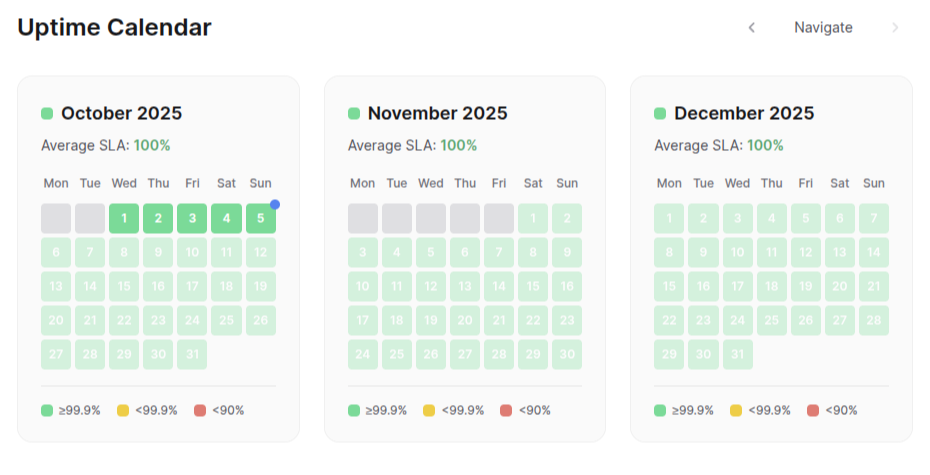
Uptime Calendar
View your complete uptime history in an intuitive calendar format. Track SLA performance across months with color-coded daily status indicators and incident details.
Eclipse Theme Exclusive: The Uptime Calendar is currently available only with the Eclipse theme. See Themes for more information.
Overview
The Uptime Calendar displays historical availability data in a monthly calendar view:
- Daily SLA Status - Each day color-coded by uptime performance
- Monthly Overview - Average SLA percentage per month
- Incident Details - Hover over days to see incident counts
- Historical Navigation - Browse months backward through your complete history
Accessing the Calendar
- Enable the Eclipse theme in Settings → Appearance
- Enable Uptime Calendar in Settings → General
- Navigate to your status page
- Click Uptime in the header navigation
The calendar loads the current month plus two previous months by default.
Understanding the Calendar
Color Coding
Each day is colored based on its SLA performance:
🟢 Green (99.9% or higher)
- Excellent uptime
- No significant issues
- SLA target met
🟡 Yellow (90-99.9%)
- Minor degradation
- Some downtime occurred
- Below optimal but acceptable
🔴 Red (below 90%)
- Critical issues
- Significant downtime
- SLA target missed
⚪ Gray (Future)
- Days that haven't occurred yet
- No data available
- Grayed out appearance
Monthly SLA
Each month shows an average SLA percentage:
- Calculated from all days in the month
- Displayed at the top of each month card
- Color-coded dot indicates overall performance
Today Indicator
The current day is marked with a blue dot in the top-right corner for easy identification.
Navigation
Browse History
Previous Months:
- Click the left arrow (←) to load earlier months
- Loads three months at a time
- Navigate back unlimited months
Return to Current:
- Click the right arrow (→) to move forward
- Disabled when viewing the current month
Incident Details
Hover over any day to see:
- Operational days - "✅ Operational" message
- Days with incidents - Number of incidents recorded
- Date - Full date for reference
Use Cases
SLA Compliance Reporting
Track whether your service meets SLA commitments:
- Navigate to relevant months
- Check monthly average SLA
- Identify days that fell below targets
- Document compliance for stakeholders
Pattern Recognition
Identify recurring issues:
- Spot patterns in outages (e.g., every Monday)
- Analyze seasonal trends
- Correlate with deployments or maintenance windows
Customer Transparency
Build trust by showing complete uptime history:
- Public status pages display full historical data
- Demonstrates commitment to reliability
- Provides context during incidents
Post-Incident Analysis
Review incident impact:
- See how incidents affected daily SLA
- Compare severity across different days
- Understand cumulative monthly impact
Configuration
Enable Uptime Calendar
- Navigate to Settings → General
- Find Uptime Calendar Enabled
- Check the box to enable
- Save settings
The "Uptime" link will appear in your status page header.
Theme Requirement
The Uptime Calendar requires the Eclipse theme:
- Go to Settings → Appearance
- Select Eclipse Theme
- Save changes
- The calendar will be available after enabling the feature
Layout
Responsive Design
The calendar adapts to screen size:
- Mobile (< 1024px): 1 month per row
- Tablet (1024-1280px): 2 months per row
- Desktop (> 1280px): 3 months per row
Month Card
Each month displays:
- Month name and year
- Average SLA percentage
- Status indicator dot
- Calendar grid (Mon-Sun)
- Day numbers with color coding
- Legend explaining colors
Troubleshooting
Calendar Not Showing
- Verify Eclipse theme is active
- Check Uptime Calendar Enabled setting
- Ensure you have monitors configured
- Refresh the page
No Historical Data
The calendar requires:
- Active monitors with check history
- Recorded incidents for downtime calculation
- At least one complete day of data
New installations will show limited history until more data accumulates.
Navigation Disabled
Left arrow disabled:
- You've reached the oldest available data
Right arrow disabled:
- You're viewing the current month
- Cannot navigate to future months
Additional Resources
- Themes - Learn about Eclipse theme
- Check Types - Monitor configuration
- Alerts - Incident management